Reports
Reports tag on the menu to the left provides several options in the drop-down list.
Authentication Failed Report
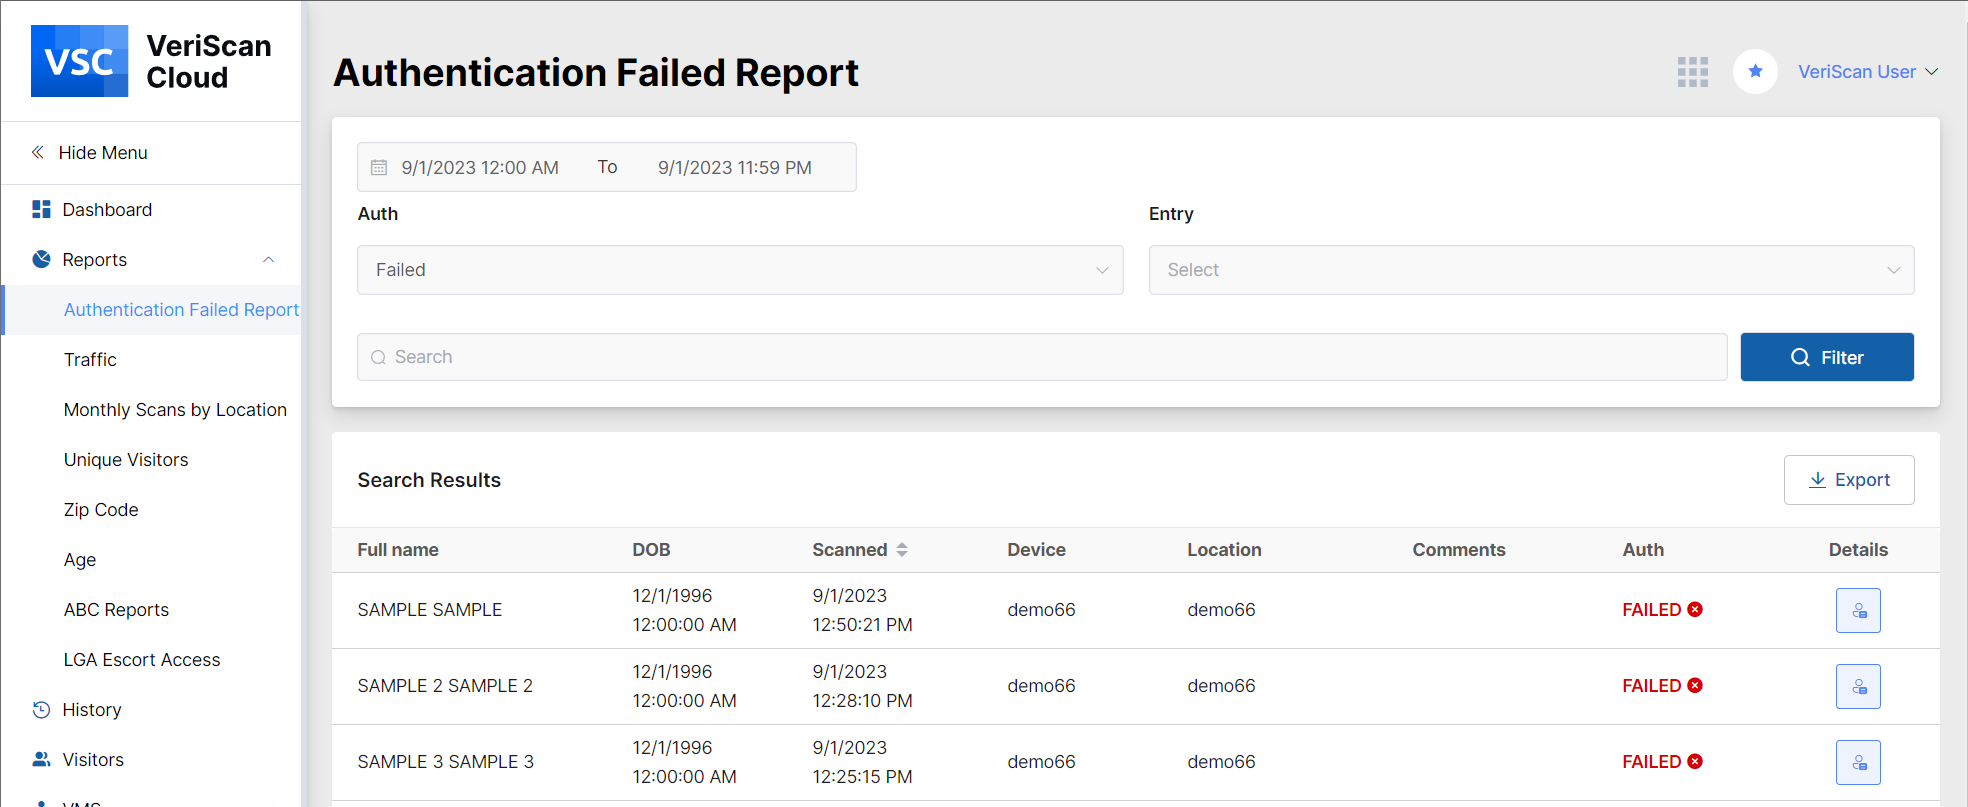
The Authentication Failed report allows you to view information about your visitors whose authntication is failed or skipped. While clicking on the Details button you mau get some general information on the person (First Name, Last Name, DOB, ID number, Expiration Date, Address, etc.), history on the person's visits, assigned customer group, information on the tests an reasons for failed authentication.
Traffic
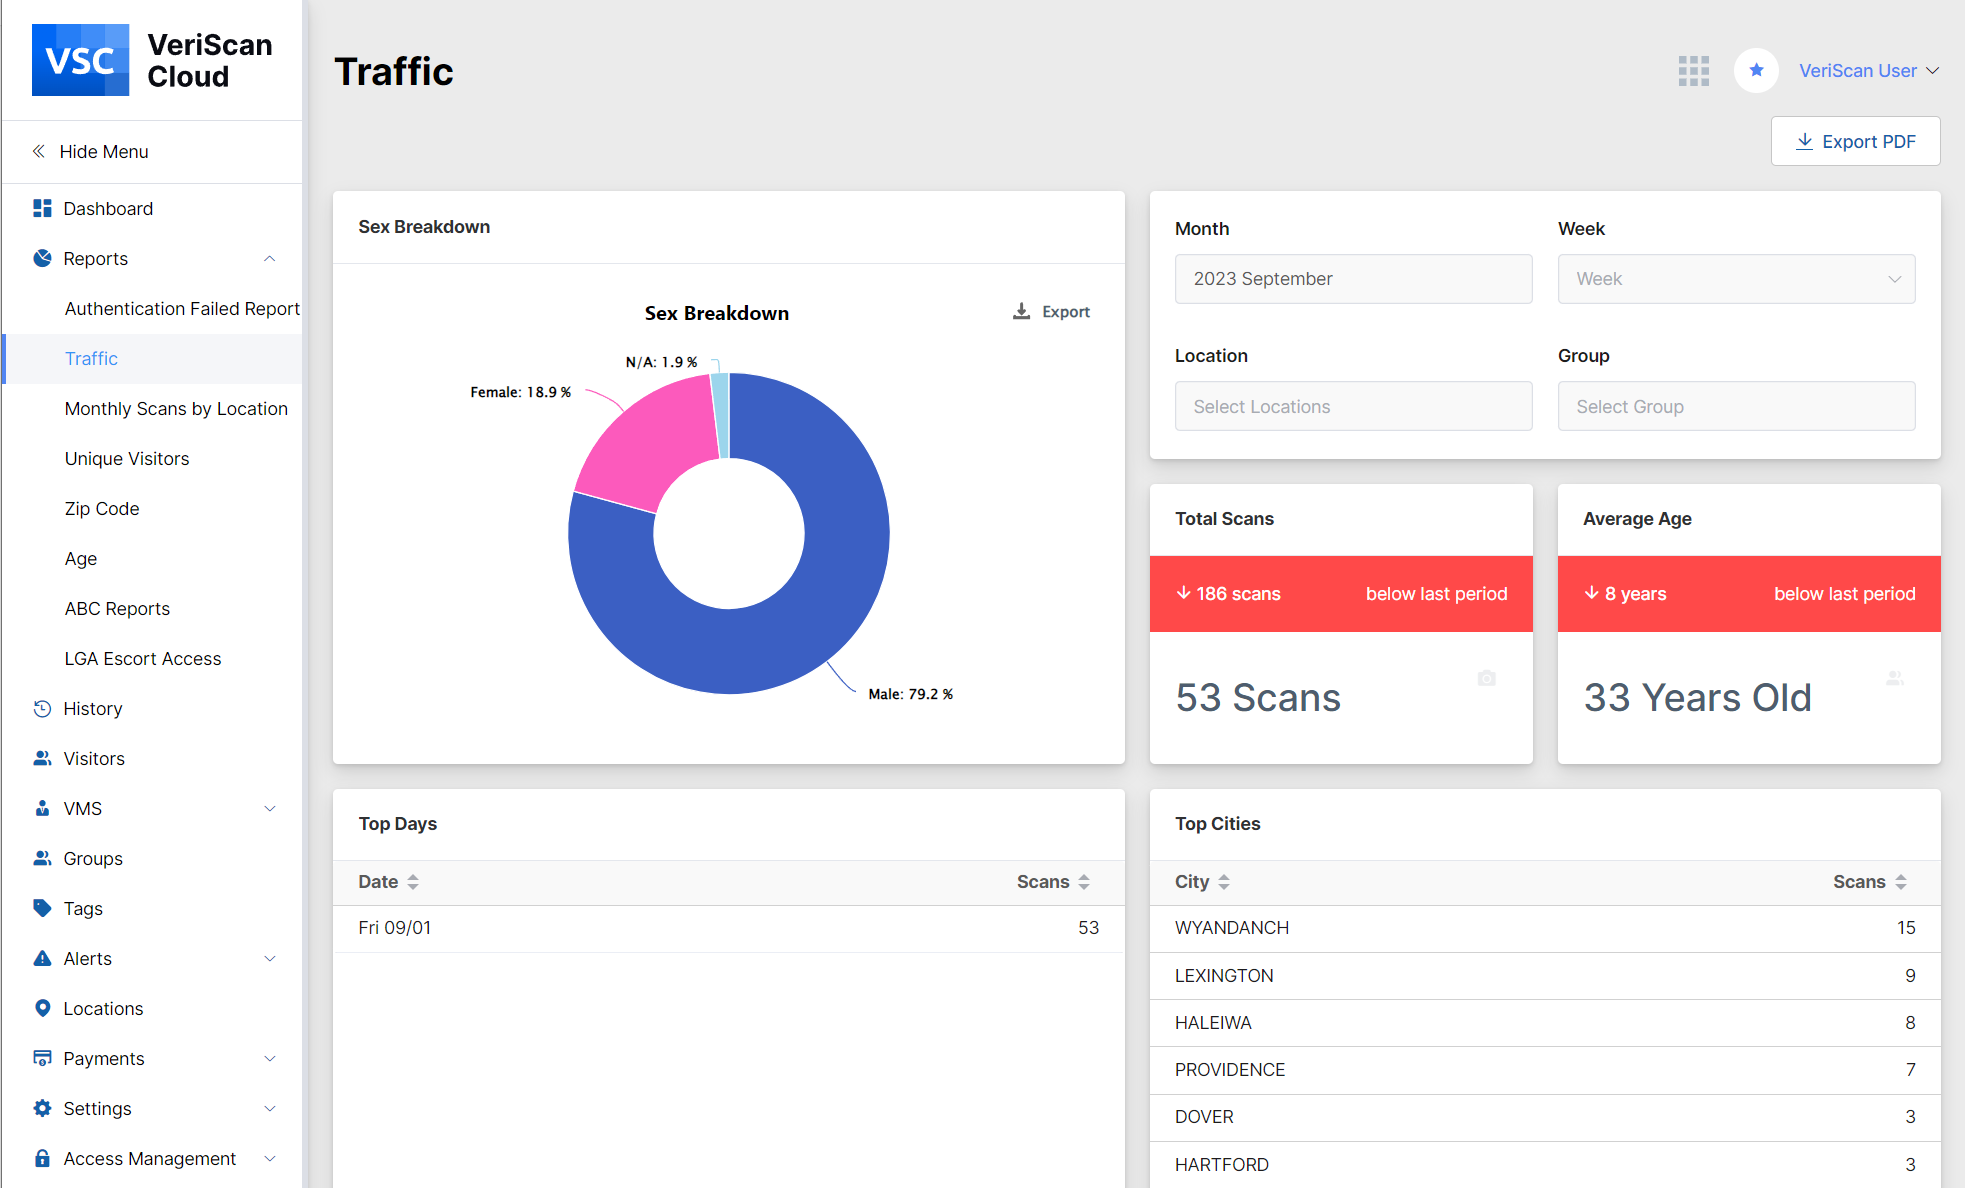
The monthly/weekly report gives you a scan summary of each month/week. There is no time limit on the past dates you may select, so you may select back to the start date with VeriScan. This scan summary includes the total number of scans for the month or week. It also shows the variances from the previous week and displays a pie chart of the gender breakdown.
The ‘Average Age’ table will display the average age based on the scans for this week and show you the difference in years from the previous week.
To see the volume of scans from a particular week, look at the box titled “Top Days.” Here you will see your scans the week you select broken down daily.
The “Top Cities’ table displays the cities with the most scans and the number of scans that occurred in each city within the 7 day period you select.
The ‘Scans by Day’ table shows you the total number of scans that occurred each day, and displays the number of returning visitors. We refer to the “returning visitors” as repeats. In the next column you will see how many of these visitors were new and how many were repeats according to each day. In the final column, a bar will be displayed for each scan day to show the number of males and females scanned in. The information can be exported to PDF by clicking Export PDF button.
Monthly Scans by Location
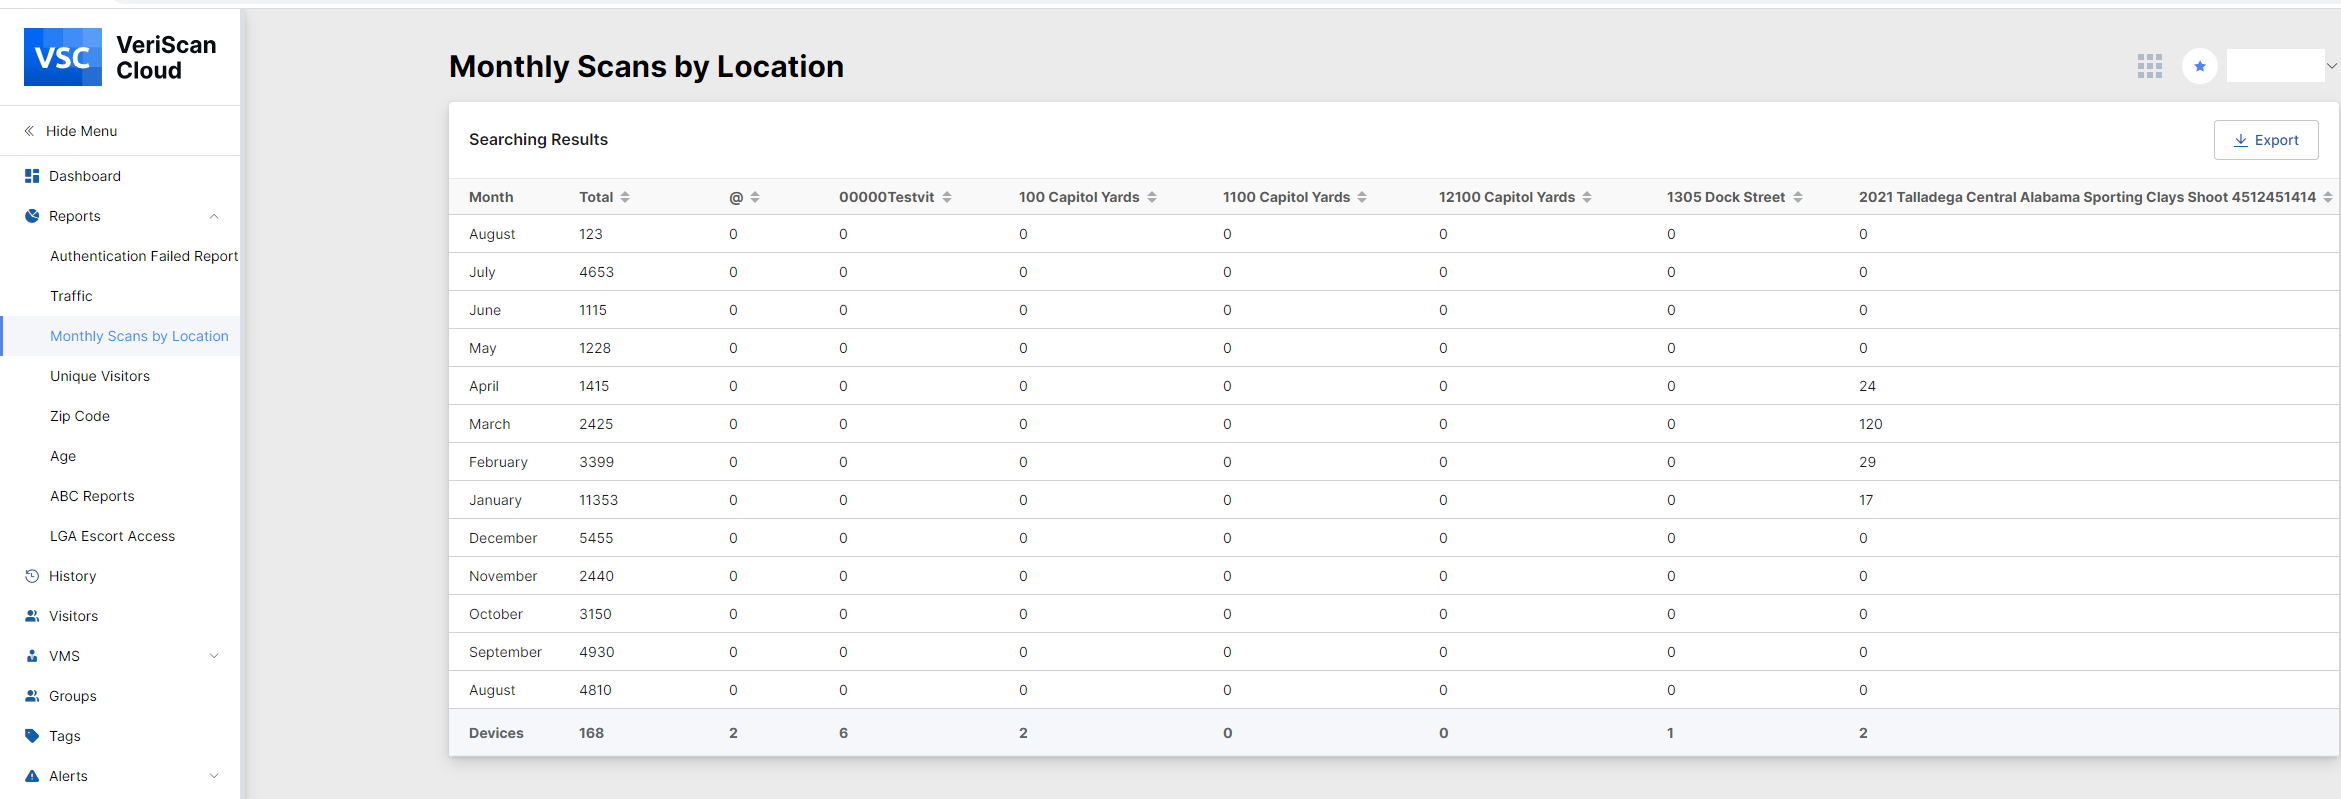
This table displays the total number of scans made per month by the location which can be selected in the search filter field. The results can be exported to excel by clicking Export link.
Unique Visitors
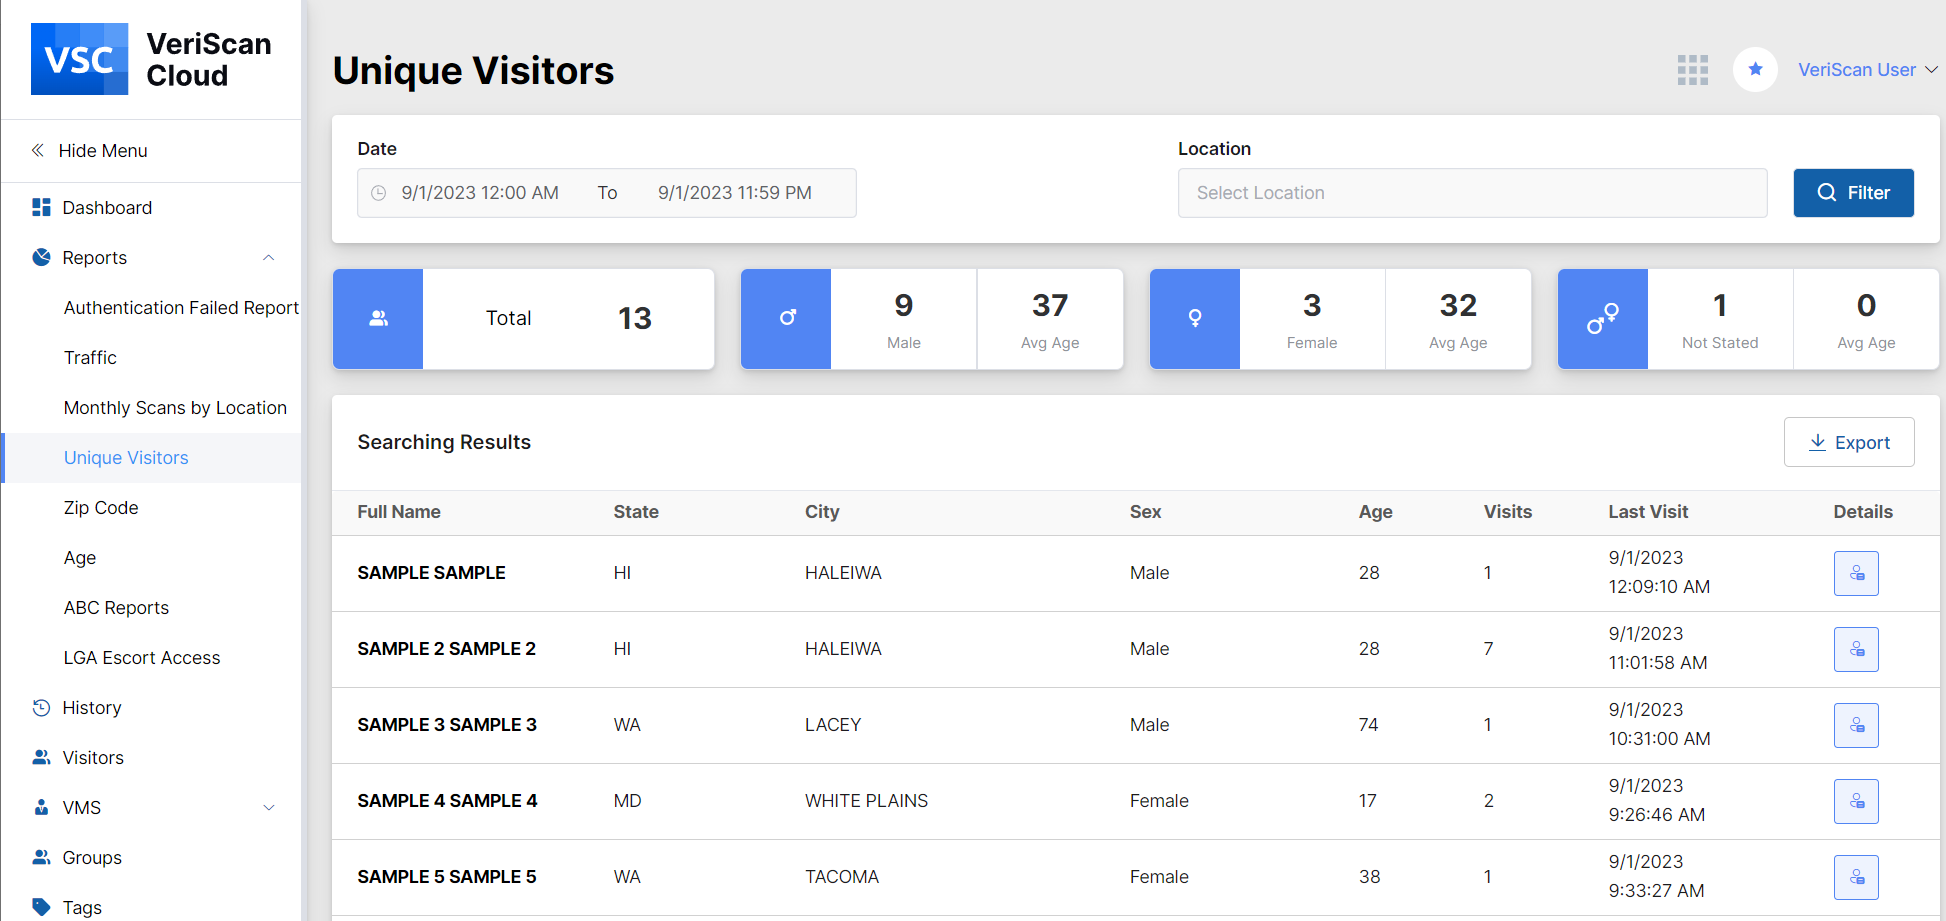
The Unique Visitors report counts the number of individuals that visit your establishment. Select your date range and include a time frame by clicking in the “from” and “to” boxes. You can also choose a period of time using the drop down. You can then select the location you want to view in the Location search field. To view the scans for all locations, leave the location set empty.
Once you have your date range, time and location selected, click on Filter to view your report. You also have the option to export and view in Excel by clicking Export link.
The report displays the total number of scans in the first box. The second box displays the number of males and their average age. The third box displays the same information but applies to females. The fourth box displays the visitors whose sex is unknown as well as their average age.
The table below the scan overview goes into detail about the visitors. The first column displays the visitor name. The second and third columns display the state and city from the visitor’s ID. The fourth and fifth columns display the gender of the visitor and their age. The sixth column displays the number of times the visitor has scanned in and the seventh displays their last visit. The final column gives you details on each visitor.
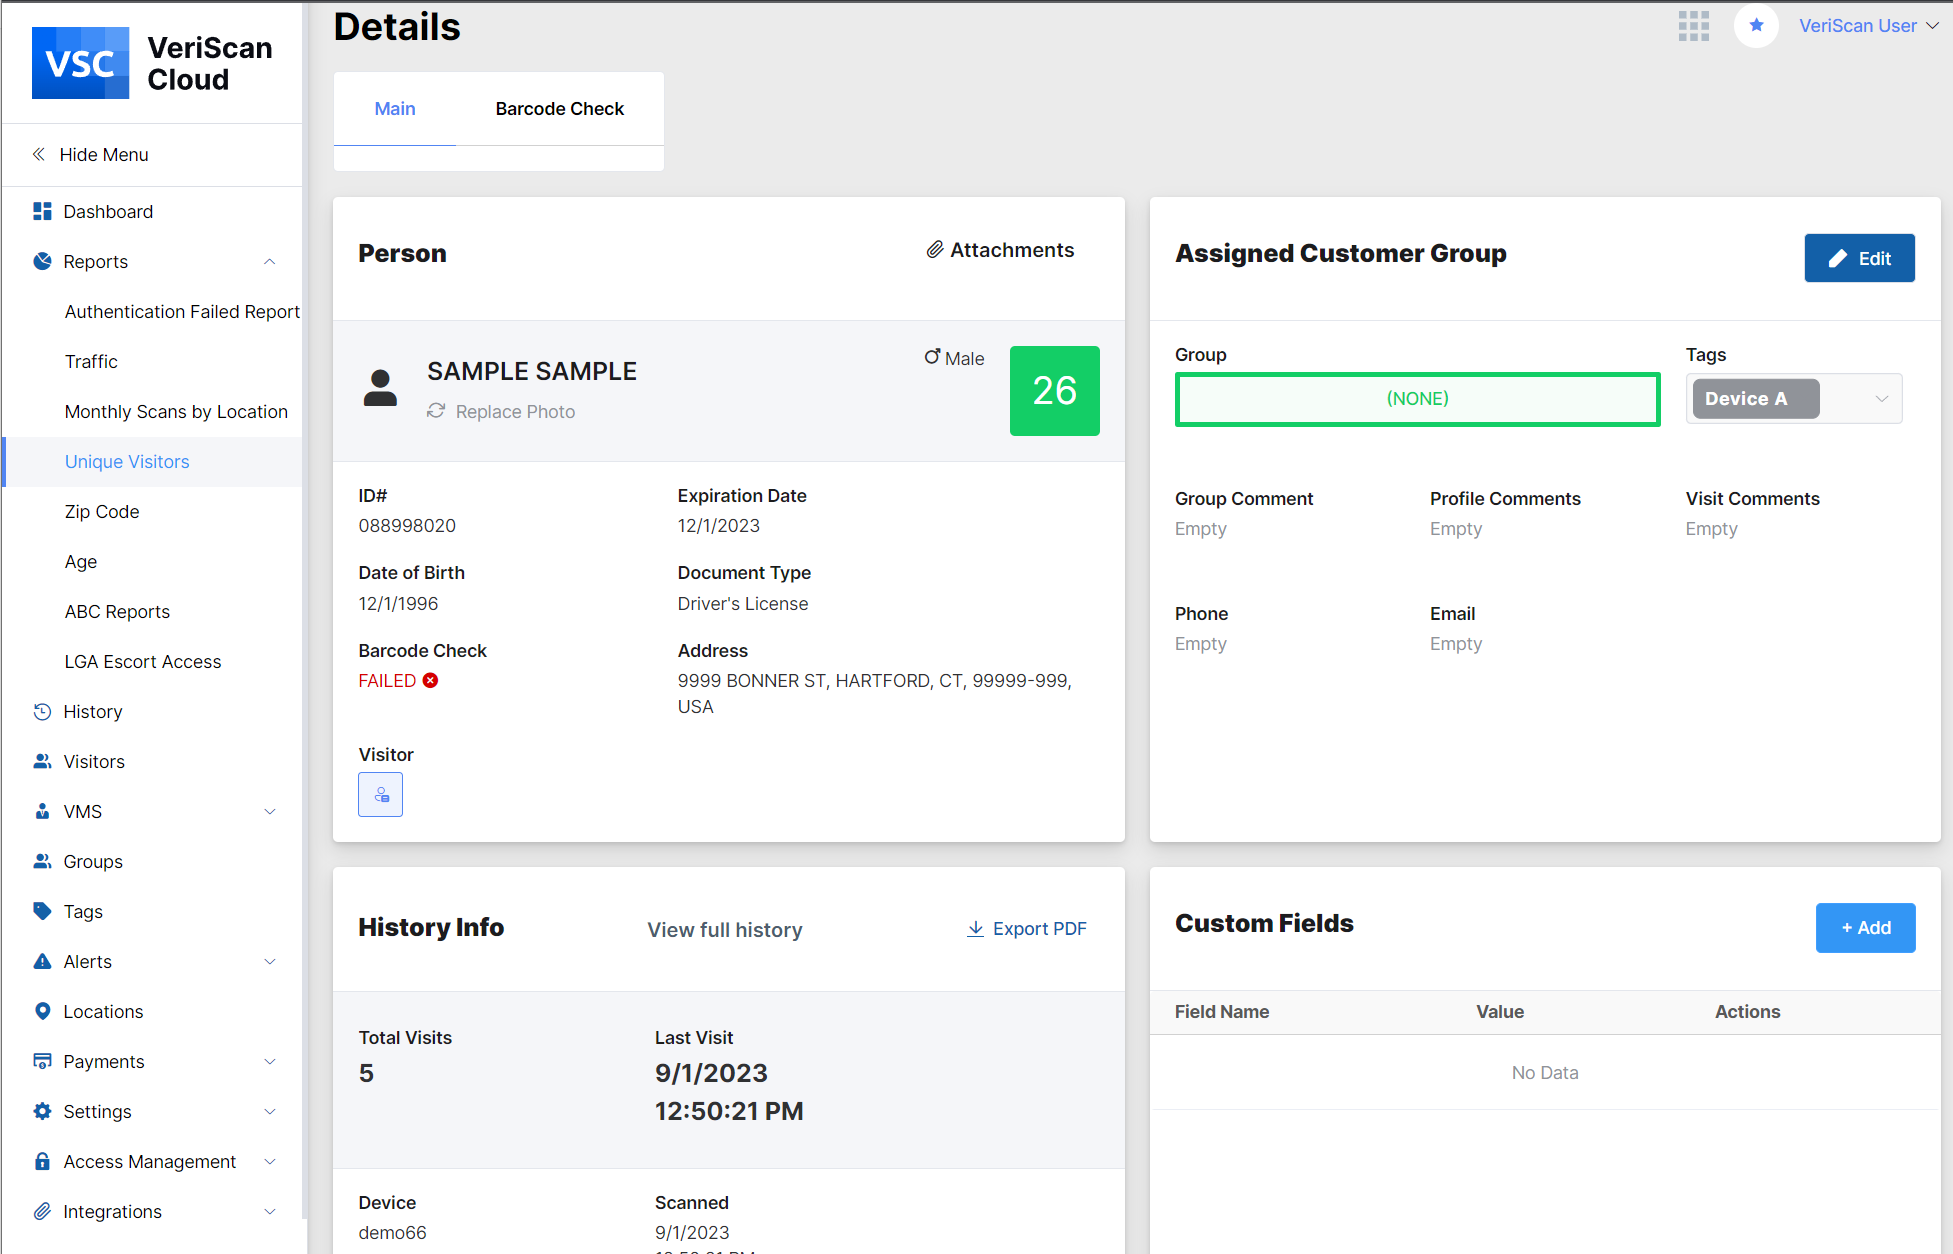
Clicking on the Details button will display details which include the visitors total number of visits, and their last visit. There is also a link which you can select to display their full history. In addition to this data, the table will also show you what time they scanned in, the location they scanned in, their ID number and any other information found on their ID. You can also add information from the visitor such as their phone, email or a comment that includes any pertinent information about them.
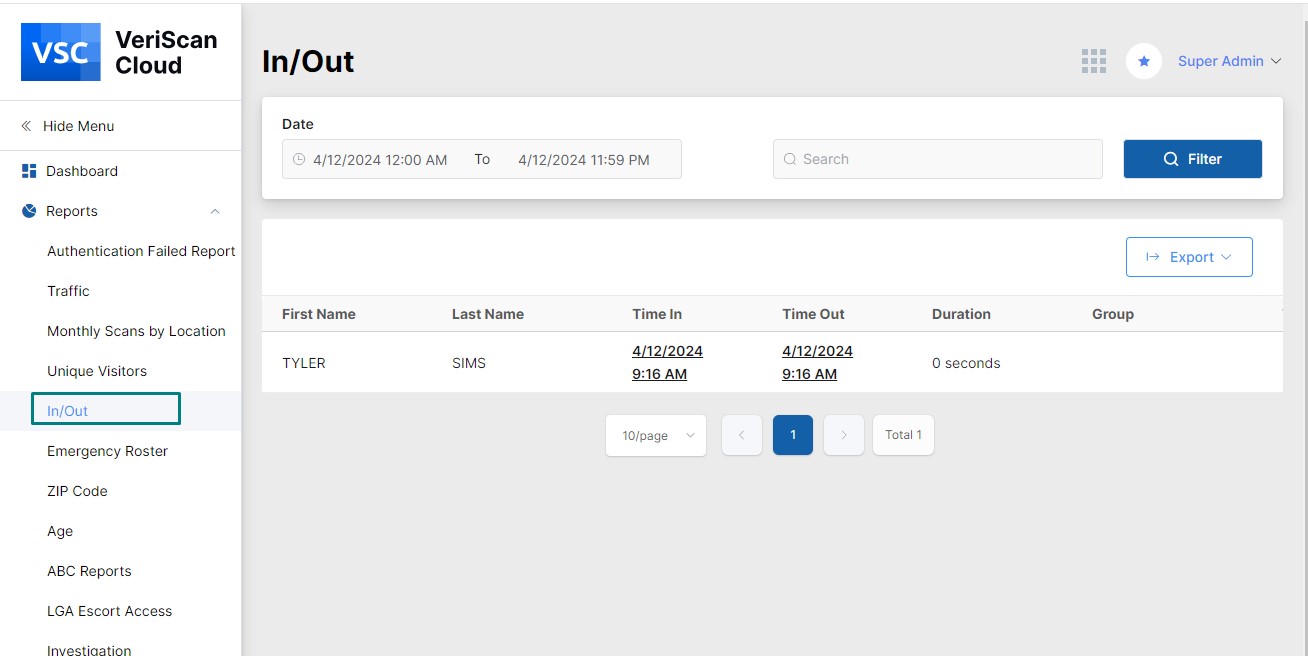
In/Out Report
The report provides information on the visitors who are on-site and off-site (names of the visitors, time in and time out and the duration of stay) . There is an option to export the report in .CSV format.
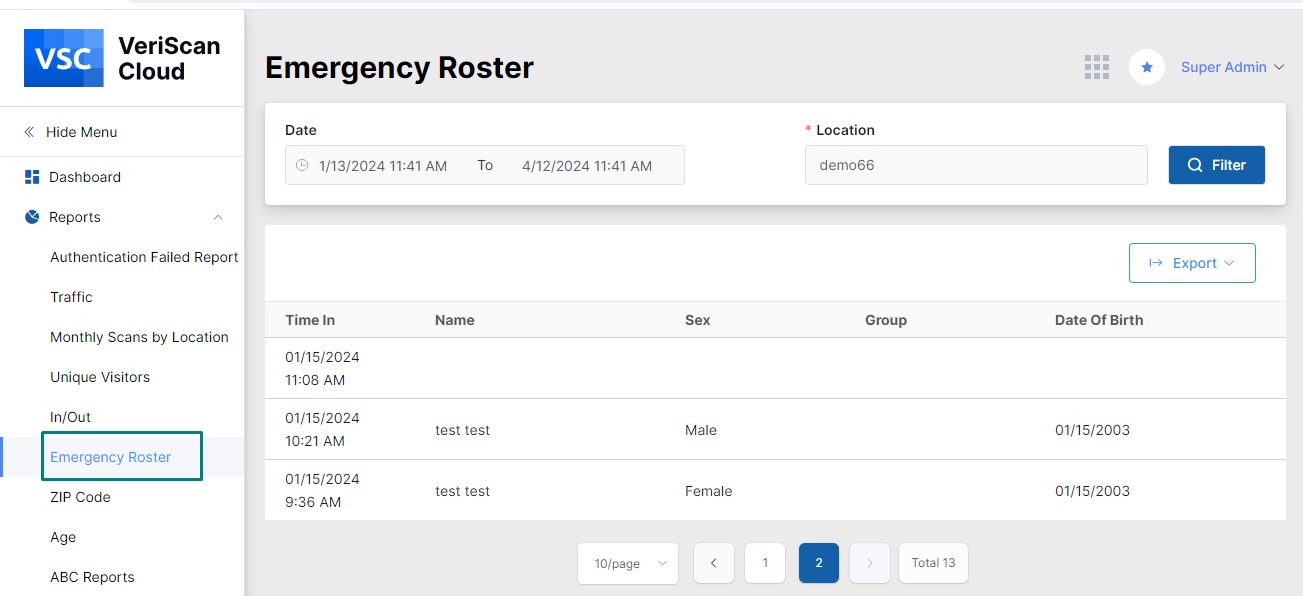
Emergency Roster
This report provides information on the visitors who are checked in. There is an option to export the report in .CSV format.
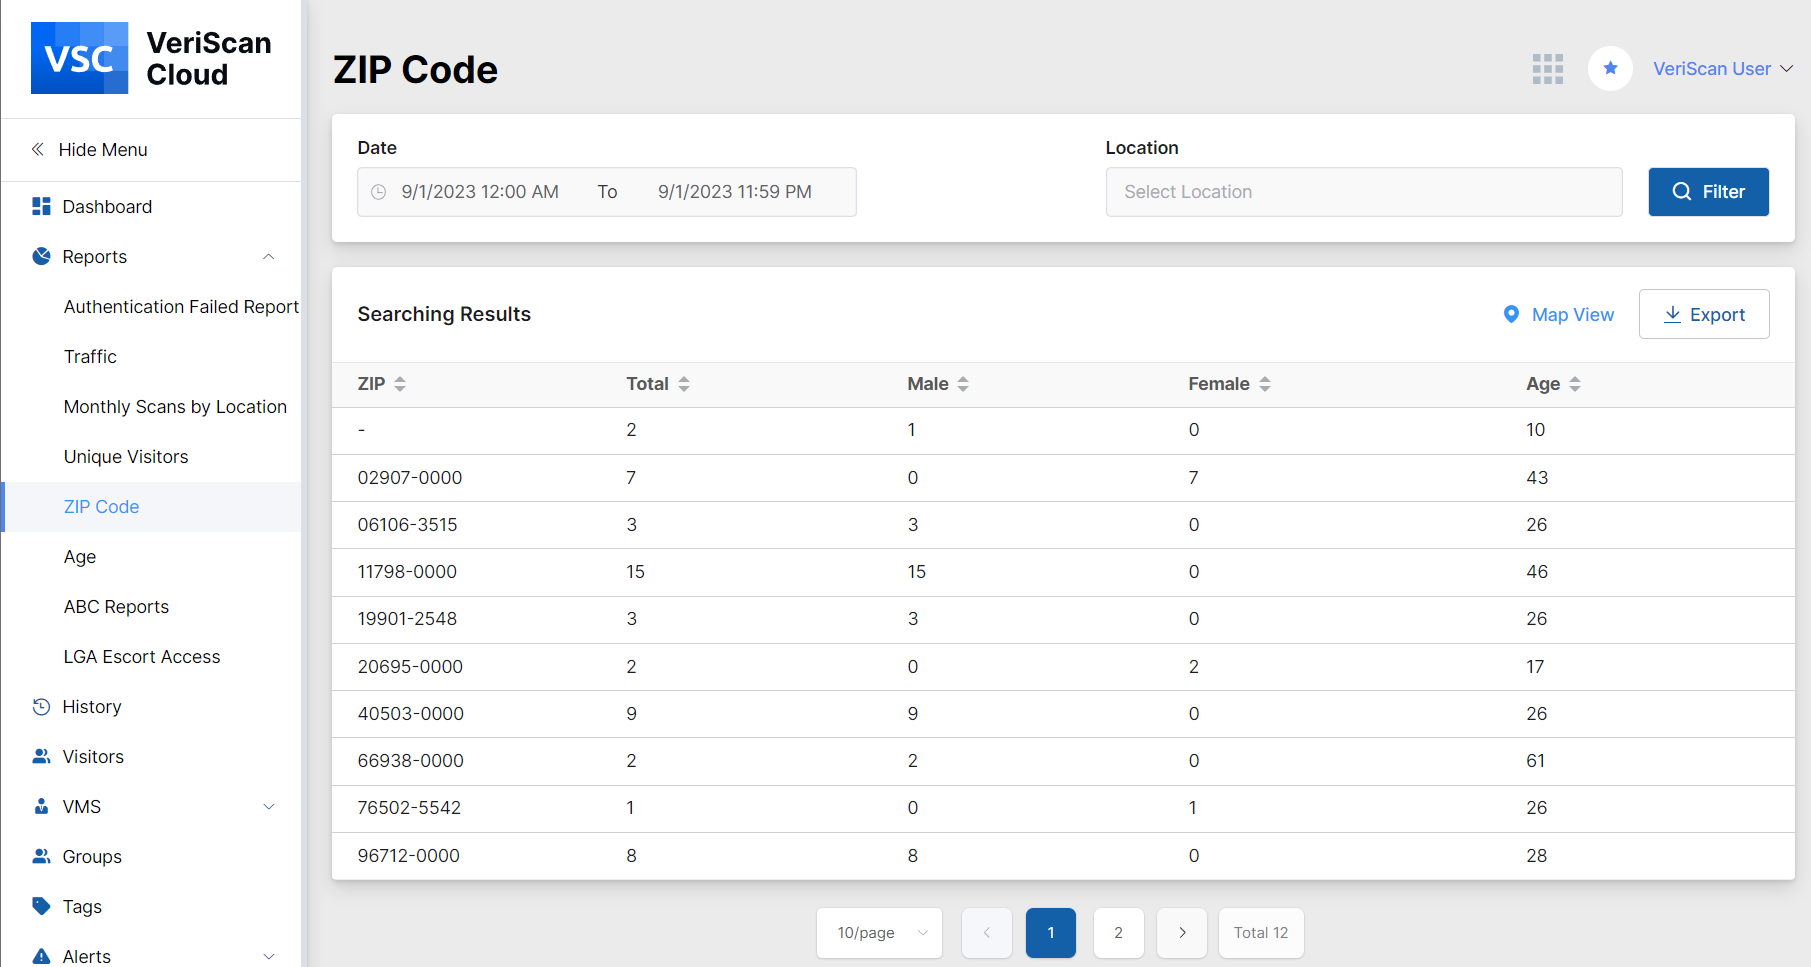
Zip Code
This report allows you to see the number of visitors from a distinct zip code. It denotes the gender of the visitor and shows the average age of the visitors from that zip code.
Enter the date you would like to see in the appropriate box and select the location, click filter, otherwise it will show month-to-date.
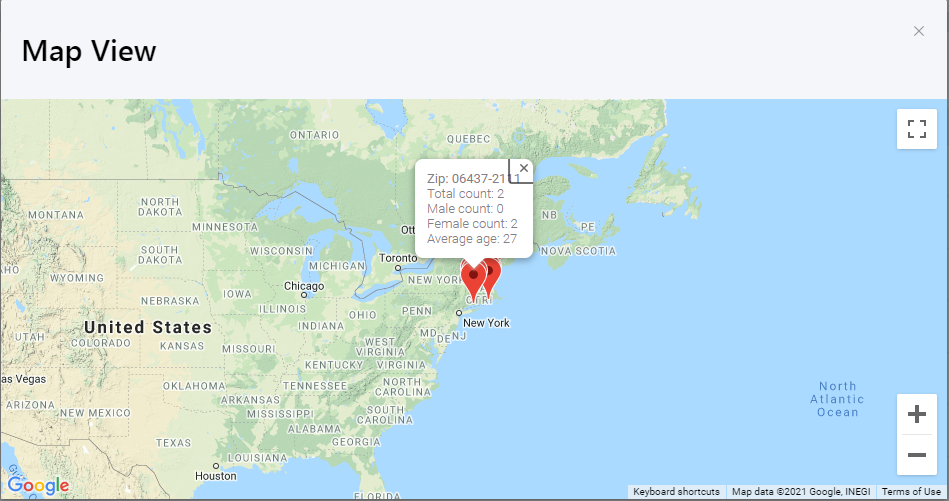
If you would like to see the Zip Code stats on a map, just click on “Map View,” and you will see different pins with the corresponding number of visitors to each zip code.
To export this data to Excel, click on the blue Export button and it will automatically download a CSV file onto your computer.
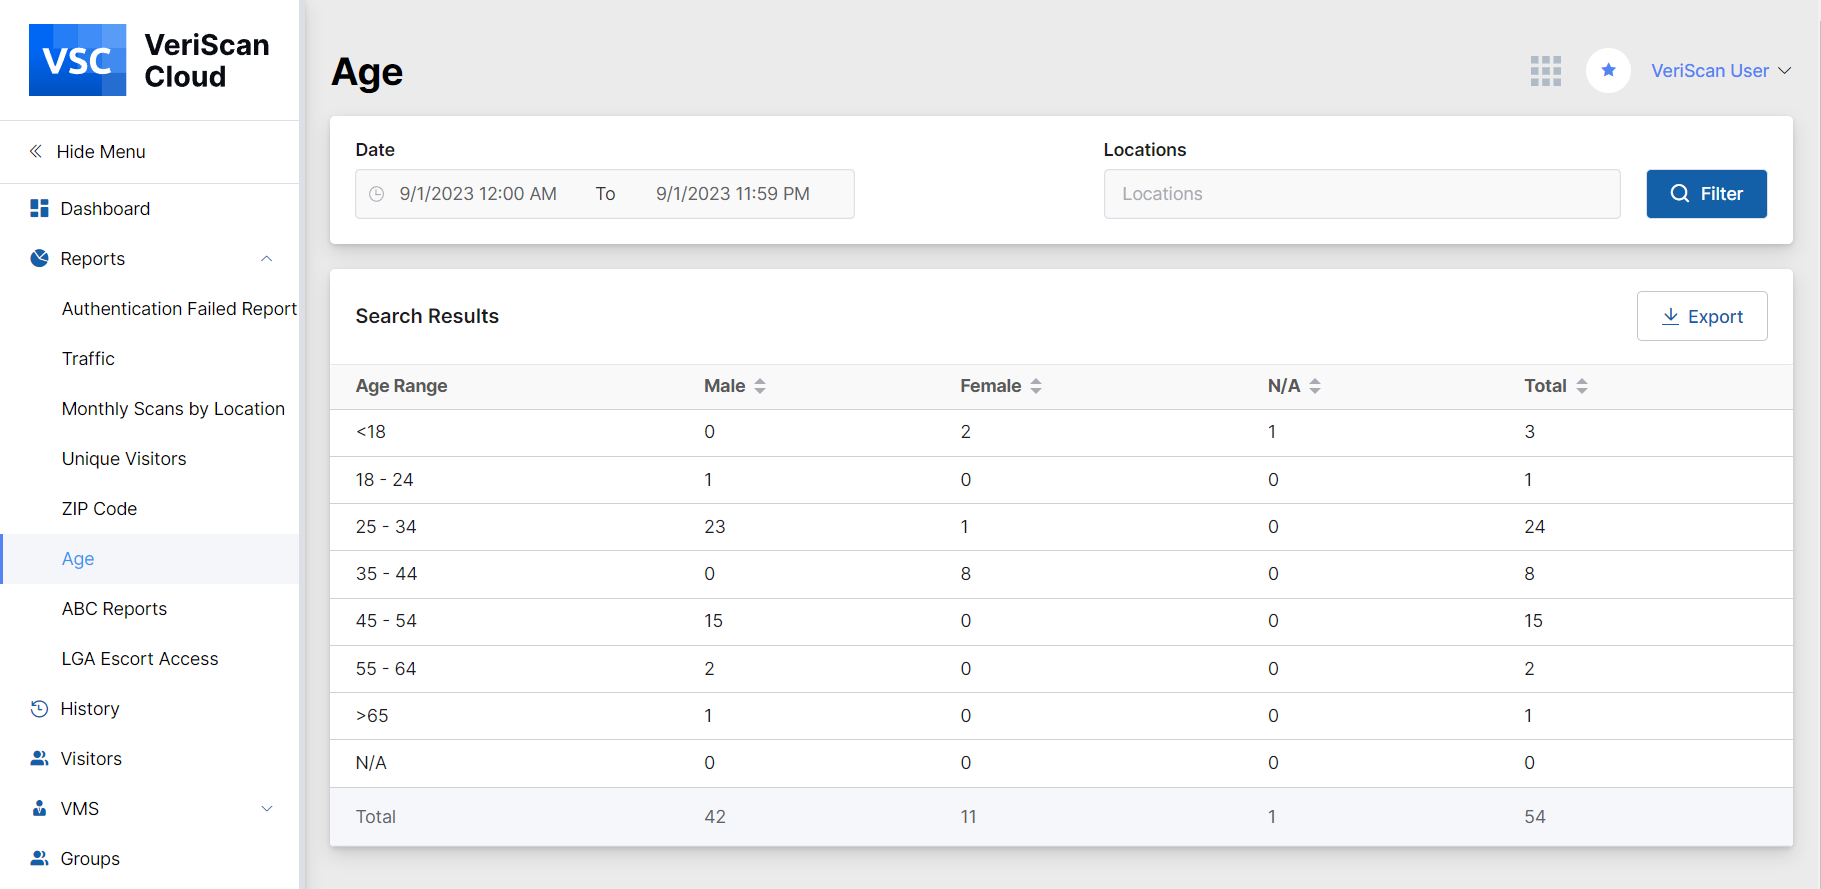
Age
This will display the average age breakdown based on the scans for the selected date, time and location. The data searched can be exported to Excel by clicking Export link.
ABC Reports
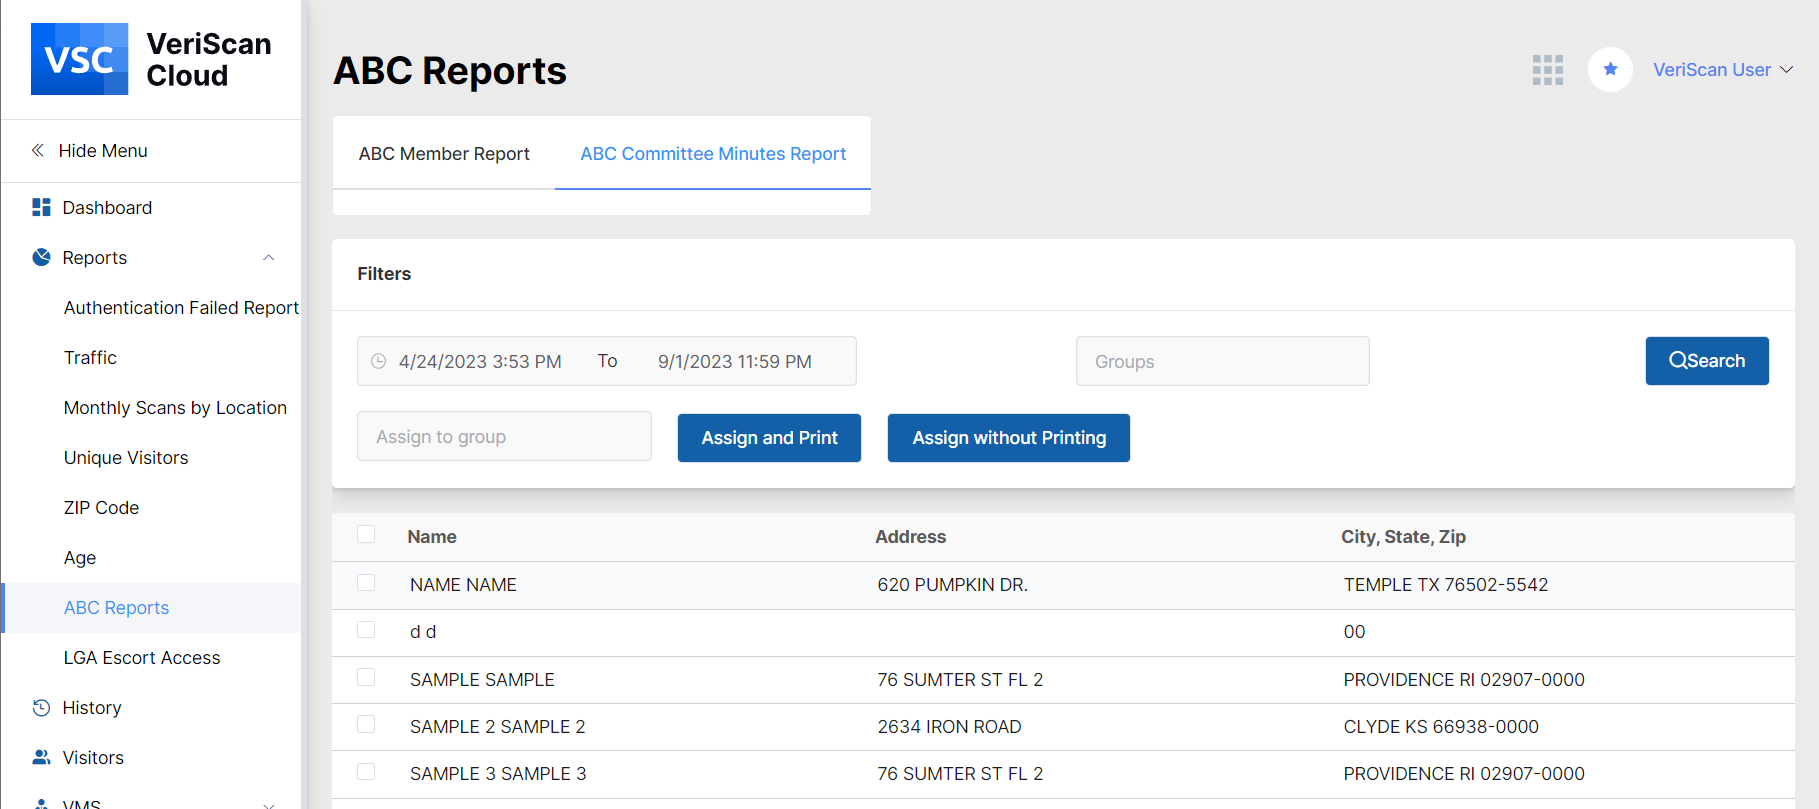
These reports provide information about the members of the Alcohol Bevarage Commission. Here you will be able to download either ABC Member Report for a specific time range and a group selected, which will give you the data on the member number, start and expire dates address and DOB of the member, or ABC Committee Minutes Report where you are able to assign a memeber to a selected group and print the report.
